
A Study of Evolution of Code Snippets on StackOverflow
Introduction:
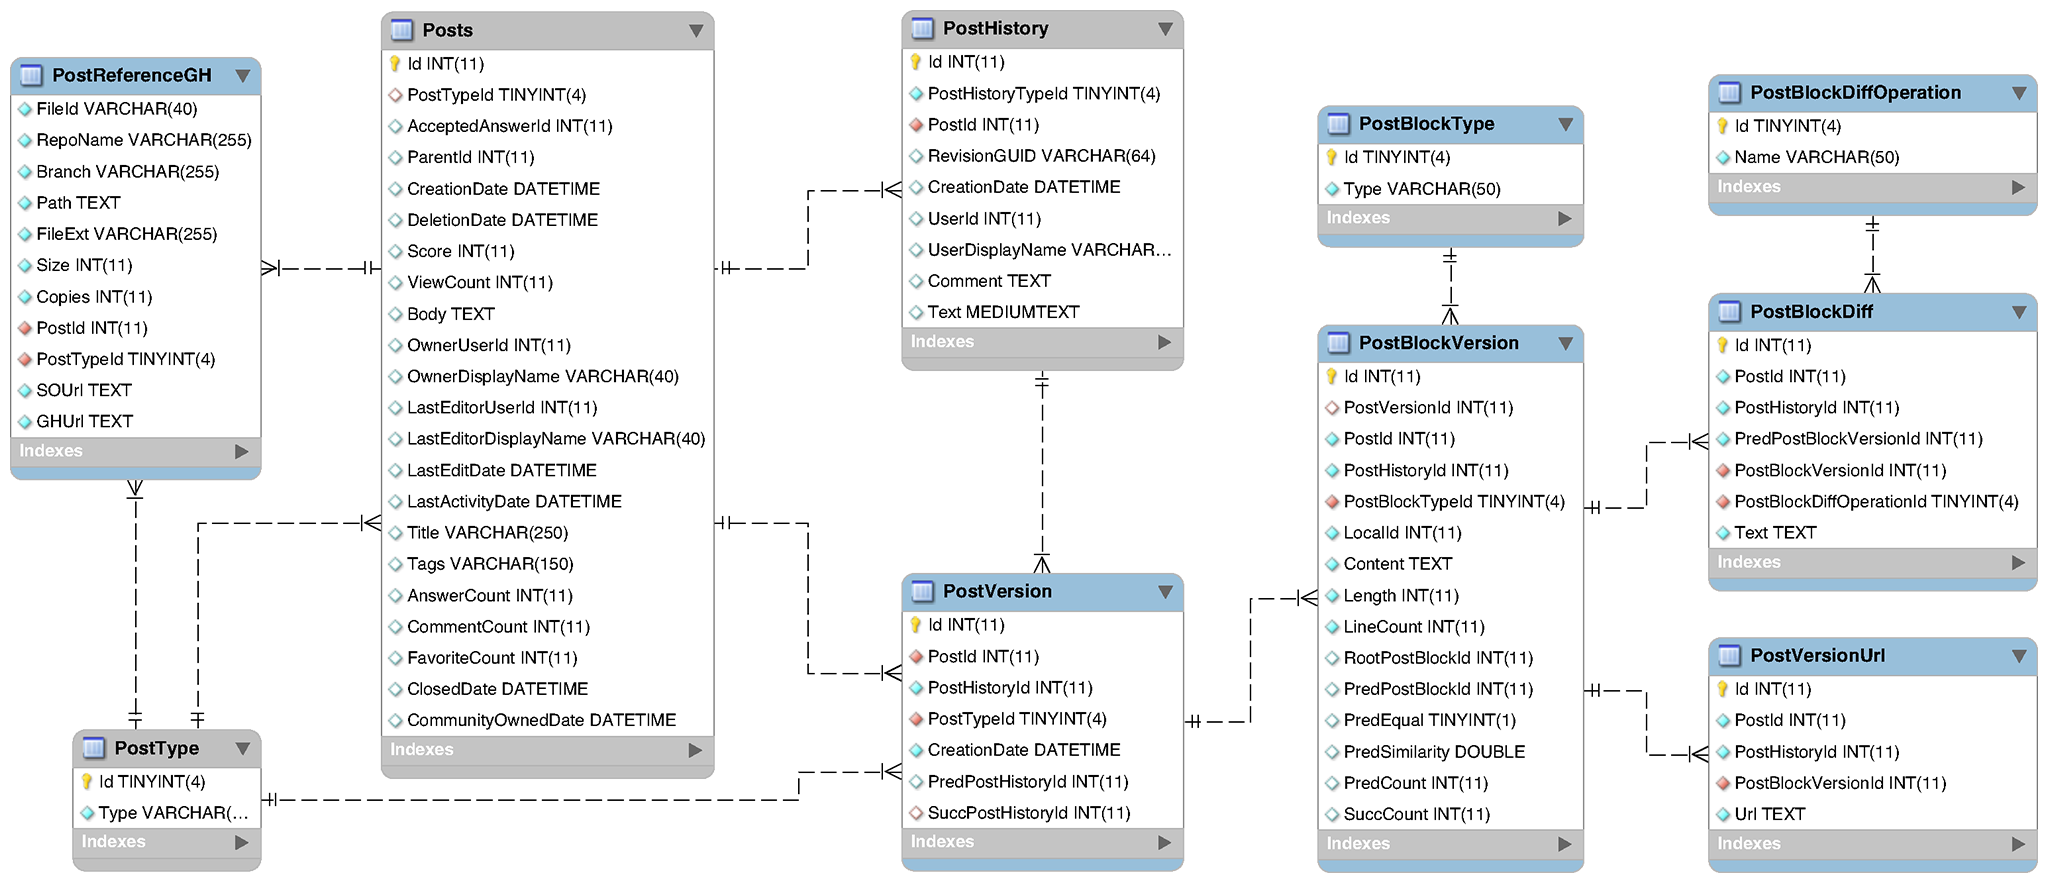
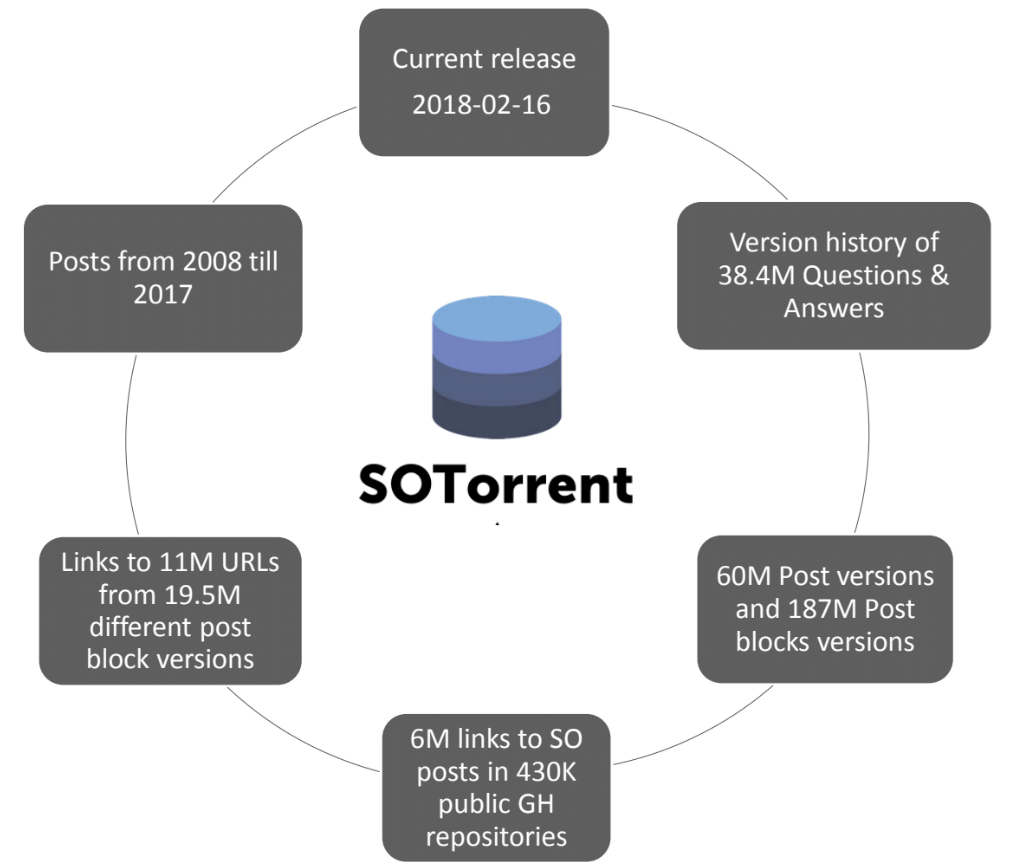
Stack Overflow is one of the most visited question-and-answer forums for software developers. This is evident from the fact that as of April 2018, it has over 39.6 million posts and over 8.5 million registered users [1]. Apart from questions and answers text, it also contains code snippets. The text and code snippets evolve over time when the users edit them. However, there is no provision in the official Stack Overflow (SO) data dump to study this evolution. SOTorrent, derived from the official SO data dump, is one such open-source dataset that provides the version history of SO texts and code snippets/blocks. SOTorrent was released by Baltes et al. [2] specifically to address the need for studying evolution of SO posts at a fine-grain level of snippets. It is hosted on Google Cloud Platform with an excellent, informative introduction by the authors on the dataset's website. It is a superset of the SO dump and you can find its short schema here. As a short introduction, here are some statistics about the SOTorrent dataset:
We mine the SOTorrent dataset to explore the evolution of code snippets on Stack Overflow. As a part of CS581 (Software Maintenance & Evolution), we (I and Abhimanyu Chawala) formulated some research questions and answered by analysing SOTorrent. We used Google Cloud Platform's BigQuery for the analysis. Note that SOTorrent has 17 tables sizing up to 289.4 GB. Under the scope of the project with given time constraints, we decided to work with a subset of the entire SOTorrent dataset. For this subset, we cropped Posts table by date and selected the records from 1st January 2016 to 11th March 2018 and cropped all the other tables accordingly. This significantly reduced the dataset size and query completion times. Consequently, it gave us results comparatively quickly.
Research Questions (RQ):
- What programming languages receive the most edits on Stack Overflow?
- What geographical locations contribute with the most edits on Stack Overflow?
- What websites are most referred-to in the posts and which GitHub projects refer to Stack Overflow the most?
- How many times the text blocks and the code blocks are getting edited in their lifetime?
BigQuery:
Web API of BigQuery is very simple to use. As seen in the Figure 2, the API has a query window at the top to query any dataset that are available within your project or that are public (e.g., SOTorrent dataset released by the authors). Right below the query area, you will see results of the query when query is completed. It also shows the schema of the database or the table that you select from the left panel. The left panel shows all the datasets, their tables, and your query history. The best thing, in my opinion, about BigQuery is that it will alert you when your query is completed. This becomes really handy when your queries take hours to run.

A standard query might look something like this:
 #standardSQL
 SELECT PS.*
 FROM `sotorrent-org.2018_03_28.Posts` AS PS
 WHERE PS.CreationDate >= '2015-01-01'
To answer the research question we created some additional tables. The queries that we used to build the additional tables and to answer the research questions listed above can be found here: q1.txt and q2.txt. Most of them are self explanatory so I will directly jump to the results/answers to those question in the section below.
Results:
Answering RQ1: We wanted to explore which languages are most frequently edited in the code snippets on SO. For this we used our CodeBlocksWithTags table and counted the languages with the most number of code blocks. Figure 3 shows the distribution of four most popular technologies – Android, C#, Python and Java. We see that Java is not only the most popular programming language on SO, but it is also the most frequently edited language in the code blocks in the posts. It tops the charts with over 3.6 million code blocks. Python follows next, and then Android and C#. However, all these three are almost at the same level. Interestingly, the combined contribution of all these three is almost as same as that of Java alone. Going a step further in discussion, we know that Android development is mostly in Java, so we can safely conclude that Java is pretty much the most used technology at present.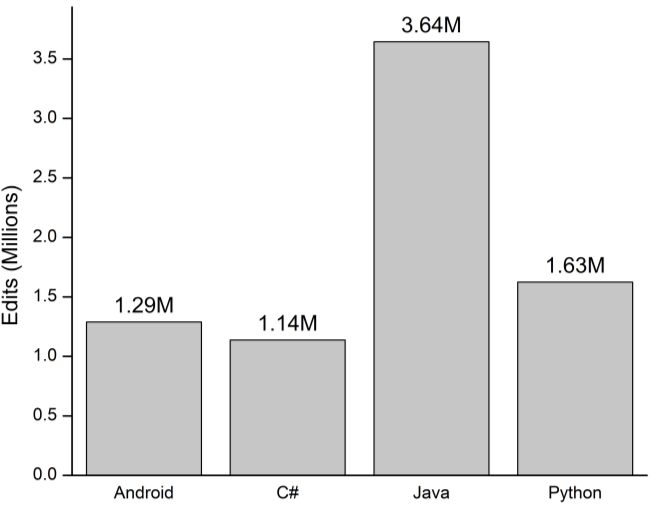
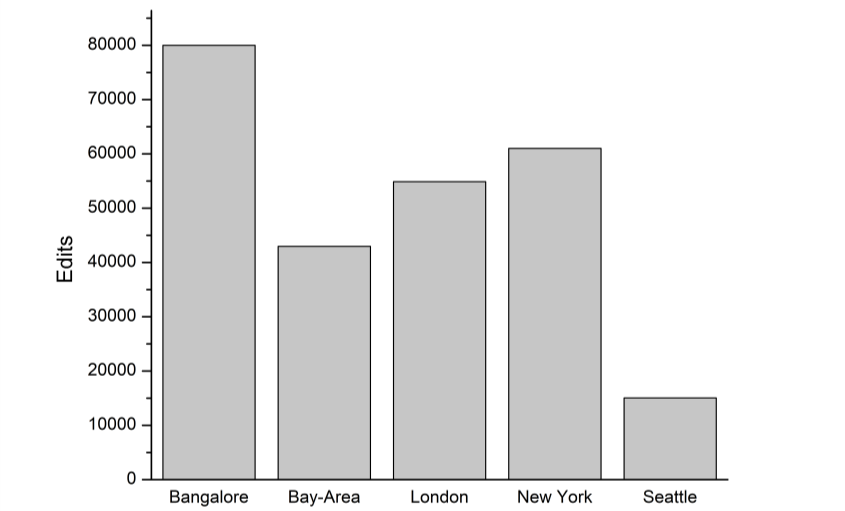
Answering RQ2: We see that the users from the city of Bangalore have contributed towards most of the edits. It is followed by New York and London, and then Bay Area in California. Seattle users have contributed the least towards the edits among all these five locations.
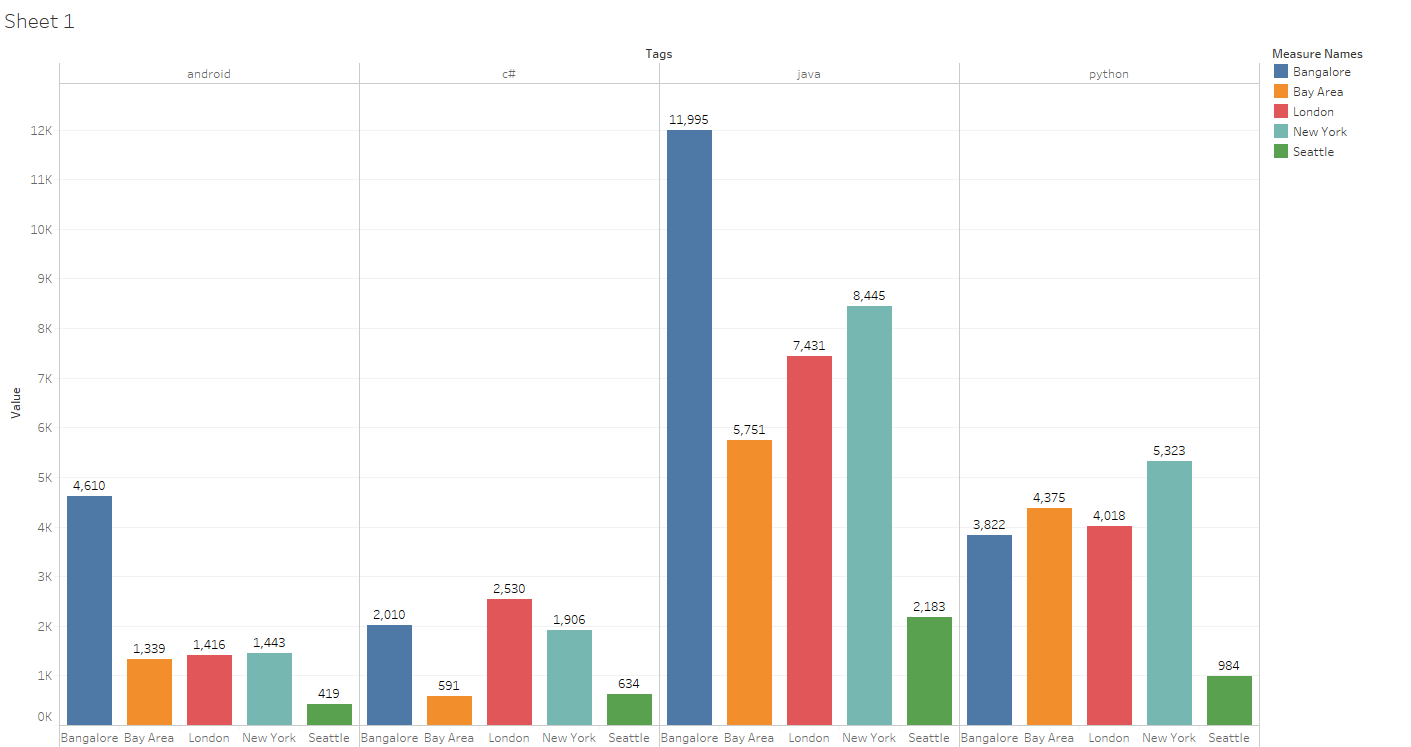
Moving further in the analysis, we tried to explore which languages are most popular among the users in these cities. So we filtered the code snippets on language and location and plotted them together. Figure 5 shows our results. Not surprisingly, Java is the most frequently edited language in the code snippets, in all the cities. However, there is a slight variation of the remaining languages in the five cities and we see some interesting results here. For instance, Android is the second most popular technology among Bangalore users, with two to three times as much edits to Android-related tags as the other four areas. So, we can say that there is a lot of Android development going on in Bangalore. London has the highest proportion of C# edit, suggesting a high percentage of developers are using the Microsoft stack. However, Bay-Area, very few users seem to use C#, as it is the least frequently edited language in this area. New York leads in Python among all cities. The ratio of Python and Java is larger than Android and C#. This could probably be due to a combination of finance, academic research, and data science at tech companies.

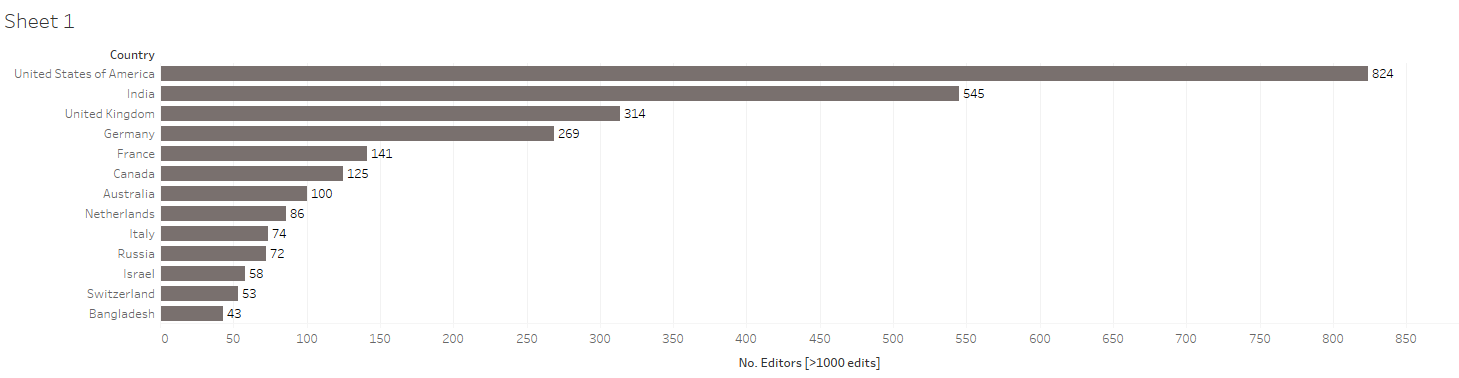
We filtered out post blocks with tags for the common operating systems – Linux, Mac OS, and Microsoft Windows, and plotted them for each of the five geographical regions to see which OS is the most popular. As shown in Figure 6, we found that for London, New York and Seattle, there is not much difference in the number of post blocks for the three OSs. However, Bangalore users post a lot of posts for Linux and very few for Mac OS. And in Bay Area, Windows is surprisingly the least popular OS out of the three. Finally, in Bay Area and London, Mac OS is the most popular OS. For the final part of this RQ, we created a table Users_TopEdits_ByLocation_1000Edits that contains all the users and their locations only if the user has contributed more than 1000 times to the post block edits. We see from Figure 7 that the USA has 824 users who contributed to post block edits in past 3 years of SO Torrent data. After the USA, we have India where most of the software development jobs are outsourced. This might be the reason why developers are contributing more given their background in software development. We observed that there is some inconsistency in the way users report their locations on Stackoverflow website. There is a large number of users who did not report their location, or they just wrote the name of city without country name, or they wrote some weird locations such as the Earth, Universe, etc. This inconsistency affected our results.
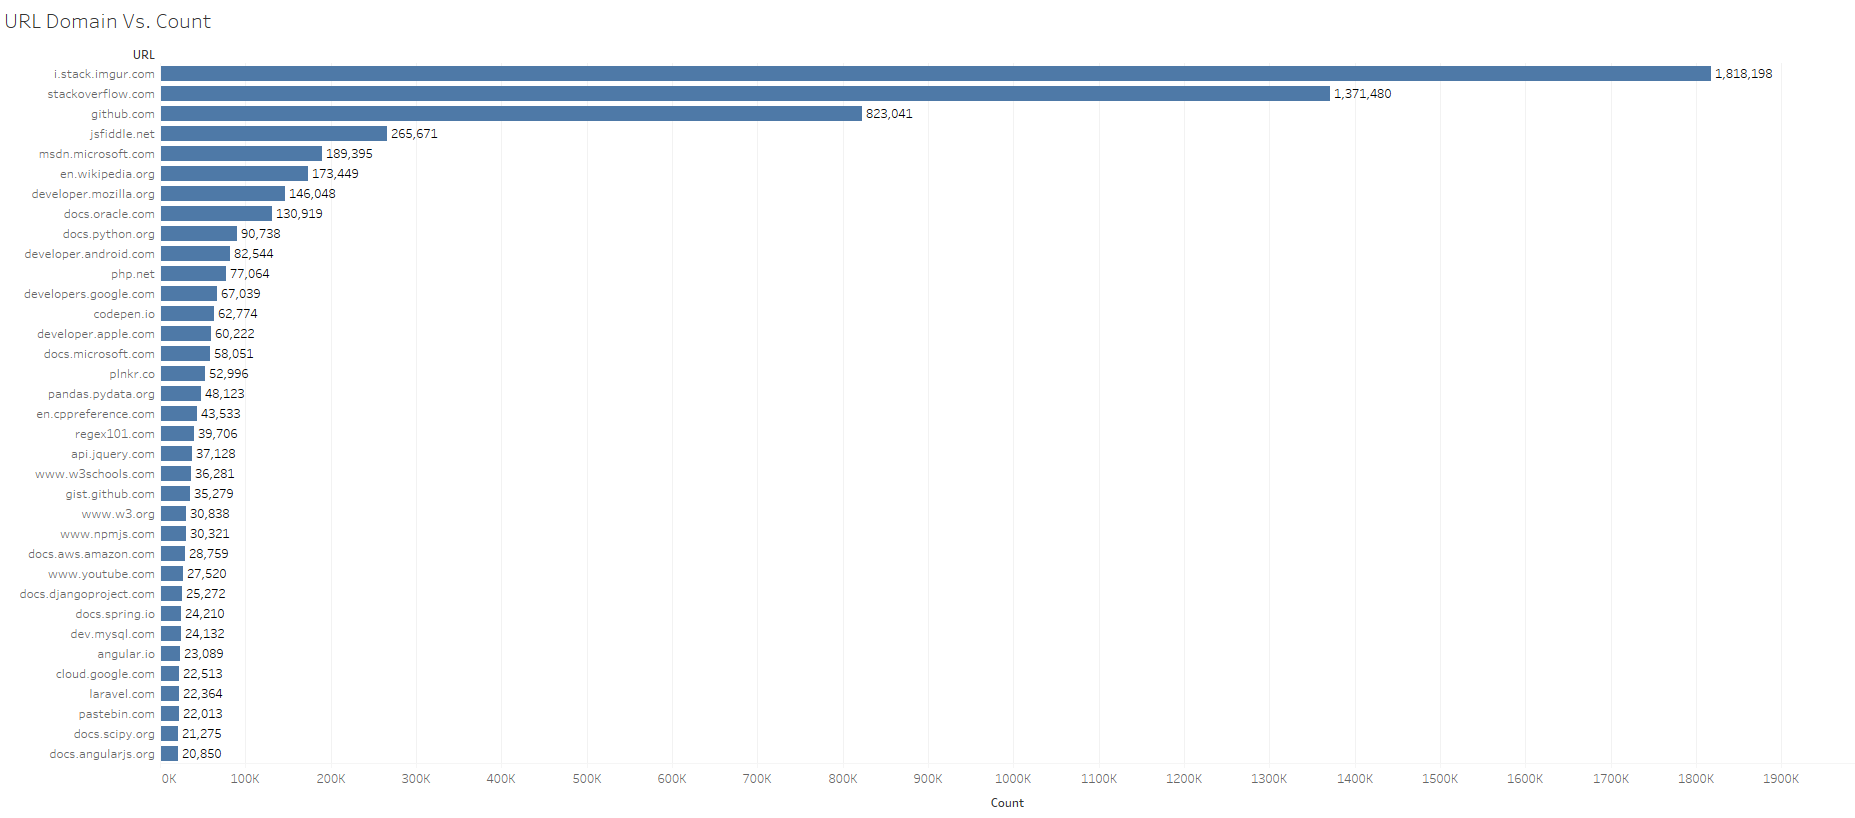
Answering RQ3: We analysed the PostVersionUrl table to extract the domain names in a standard format (for example www.domainname.com) and then sorted the domain names in the order of frequency of their use. The results in the Figure 8 show that the I.stack.imgur.com and stackoverflow.com are being referenced more that 1 million times in the posts blocks and code blocks. This seems consistent with the general observation on SO website where we see that users tend to post images of codes that are hosted by the popular image hosting website imgur.com and users tend to refer to other posts from the stackoverflow website in the answers. We also see links to links to popular websites in developers such as github.com, python.org, oracle.com, and also the wikipedia.com. Analysis of PostReferenceGH show that GitHub repositories such as cdnjs, tensorflow, etc have more links to SO posts. This analysis was trickier because the SOTorrent dataset does not take into consideration the fact that GitHub users usually fork the original repositories frequently. Therefore, the links to SO is added in the table for every single fork of the original repository. For example, we observed that cdnjs/cdnjs project was forked by over 100 GitHub users. So, the 1837 links in the original repo were added in the table for every single fork.
Therefore, we had to manually analyse the table which sorts the repos by the frequency of the SO links. The results in the Figure 9 show that the repo cdnjs has the most links to the SO website. We can also observe that the repos like TensorFlow that were introduced in the period has many links to SO posts owing to the fact that it is still under the development.

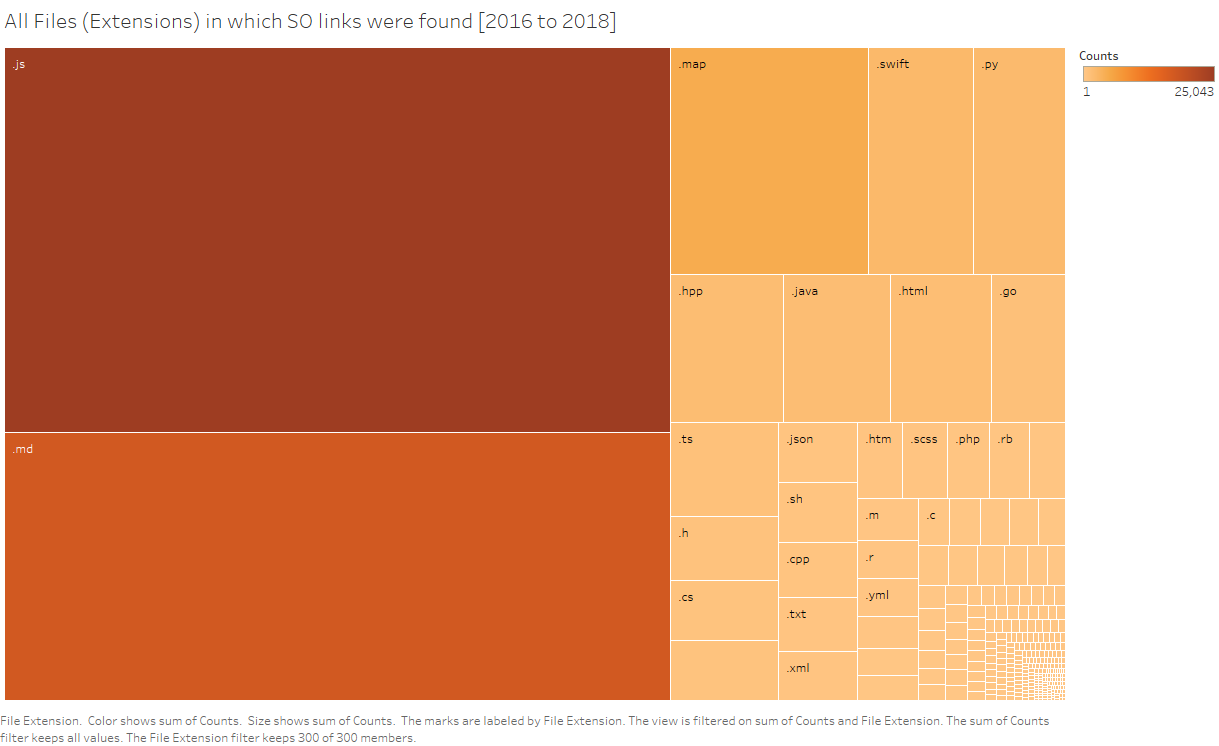
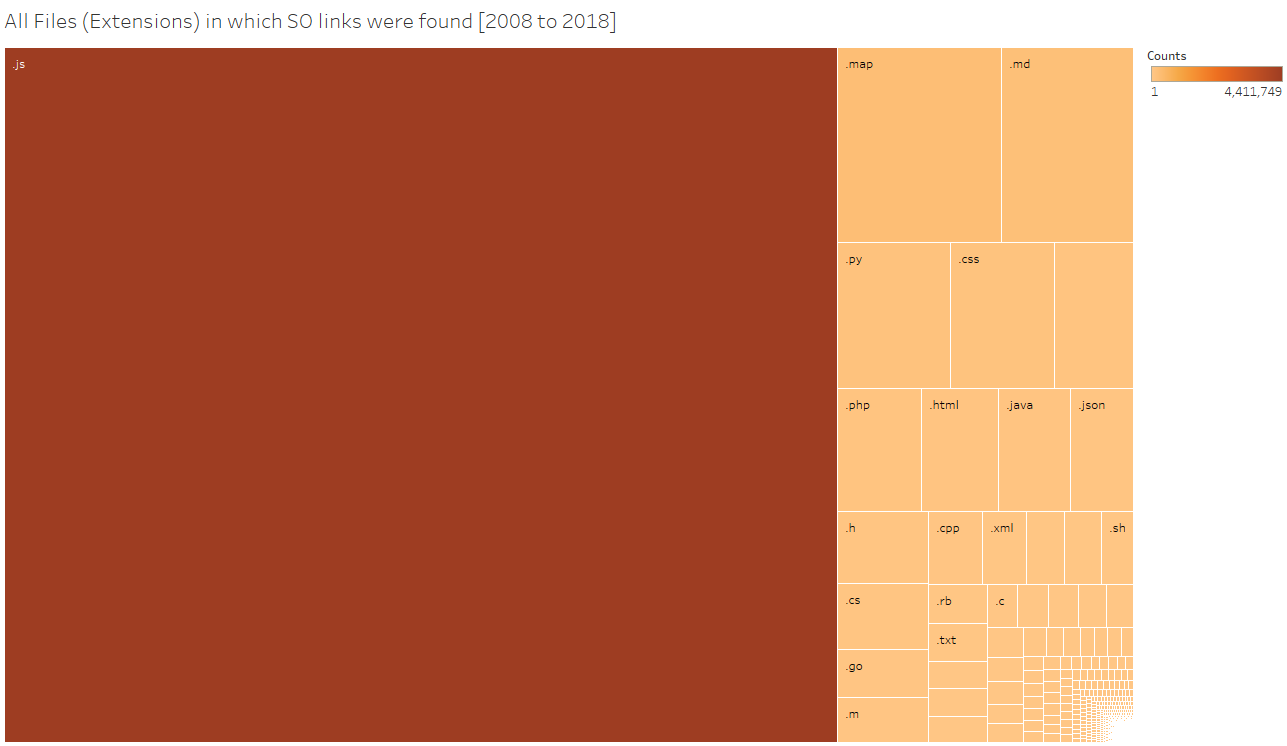
Finally, we also analysed what are the languages used in the repos that frequently refer to the SO posts. For the 3 years of data, we observed that .js, .swift, .py files have more references to SO posts, which suggests that languages like javascript, swift, python were popular, and developers wrote many snippets in these languages. We have presented the results in Figure 10 and 11. For the entire 10 years of data, we observed that developers had many snippets in javascript. However, languages like swift and go were not popular when all the data is considered together.
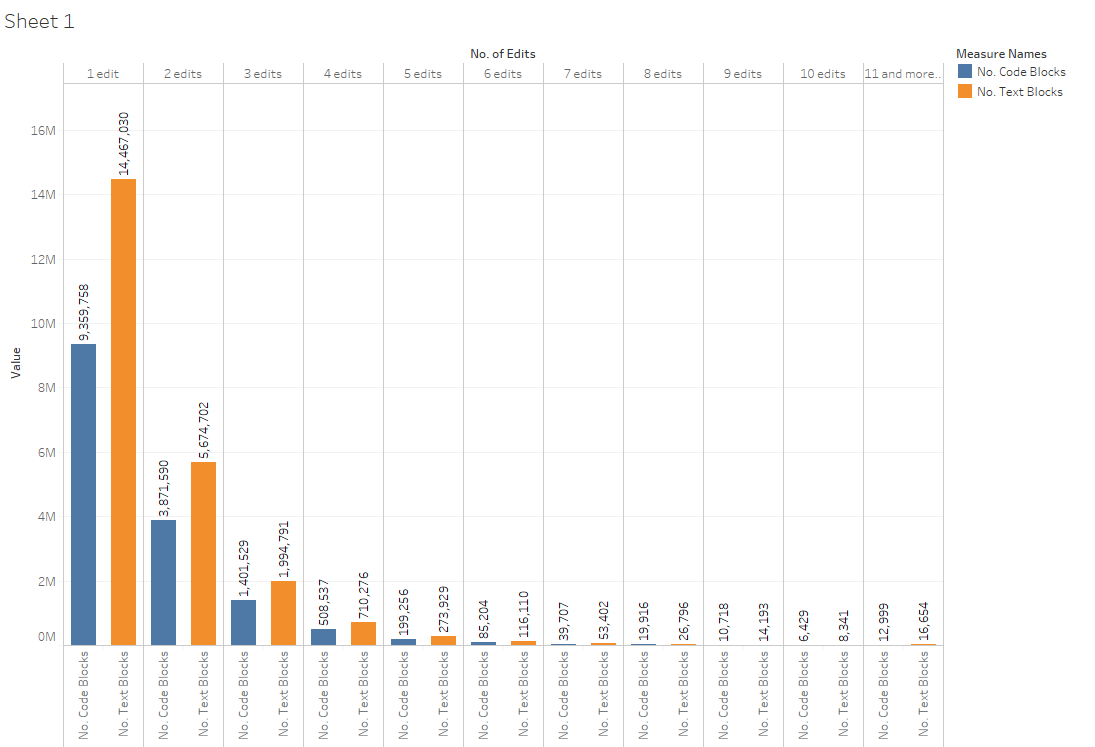
Answering RQ4: We used PostBlockVersion table to count the number code and text blocks with 1 edits, 2 edits, and so on. We observed that 60.32% of the code blocks were only edited once while 61.94% text blocks were edited only once. From Figure 12, we see that most of the blocks are edited at most 4 times. We observed that some of the blocks were edited over 50 times in their lifetime. This analysis suggests that a text or code block would most probably be edited between 1 to 4 times.
Conclusions:
- Analysis of SOTorrent answered all our research questions involving evolution of post blocks revealing expected patterns like such as imgur being the most referenced website and unexpected patterns such as developers in Seattle (Headquarters of Windows) have tagged Windows fewer times than other OS like Linux or MacOS.
- cdnjs repo is forked 3651 times on GitHub which causes many issues during the creation of SOTorrent dataset. The repo has several thousands of .js files and within them there are several links to SO posts. The tables likePostReferenceGH have 'kind of' replicated data because of the large number of forks.
- Repositories forked multiple times should be detected and correctly accommodated in PostReferenceGH table in order to have normalized and balanced database.
References:
- Stack Exchange Inc., Stack exchange data dump, 2018, https://archive.org/details/stackexchange.
- Baltes S., et al., SOTorrent: Reconstructing and Analyzing the Evolution of Stack Overflow Posts, arXiv preprint arXiv:1803.07311, 2018.