
Analysis of Yelp Business Dataset: Feature Selection, Prediction, and Sentiment Analysis
Objectives:
- Feature Selection
- Ratings Prediction
- Sentiment Analysis
- Geo-spatial Visualization
Yelp Dataset Description:
Yelp Business dataset is freely available for academic research. It covers the businesses from select major cities such as Pittsburgh, Charlotte, Urbana-Champaign, Phoenix , Las Vegas, Madison, and Cleveland from the USA and few more cities from other countries. The original data is subdivided into five different sub-datasets viz., business, review, user, check-in, and tip. Each of these sub-datasets is a JSON file with one JSON-object per line, which contain nested JSON arrays and objects.
- Sub-datasets: Business, User Review, Check-in; Total size: 5 GB
- Business: 144K businesses with stars, attributes, categories such as parking availability, happy hour, drive through, restaurants table service
- Review: 4M user comments, useful votes
- Check-in: check-in counts
Challenges with Yelp dataset:
- Huge feature space with categorical features: Yelp dataset has numerous categories in the features like business attributes, categories, zip-codes, etc. These features are qualitative features that does not have a numerical value associated with them.
- Integration of sub-datasets: Another challenge was the integration of four different sub-datasets using a number of map-reduce jobs. For example, in one of the methodology we require the dataset in the form of business_id, attributes_count, categories_count, check-in_counts, review_counts, stars. This requires a series of map reduce jobs to get rea data with required fields.
Feature Selection & Ratings Prediction:
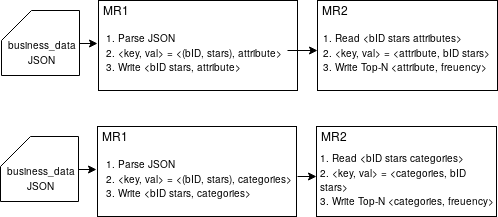
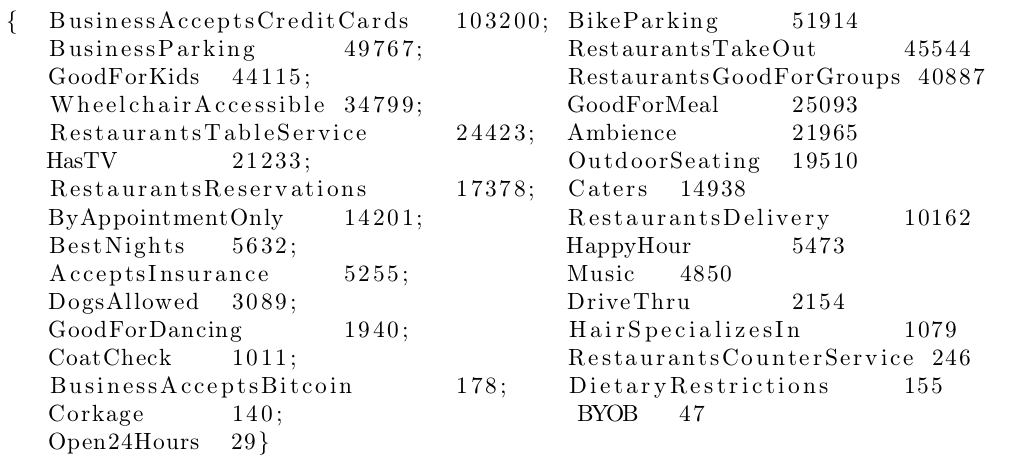
Yelp business dataset has a large number of features in the attributes and categories columns. These features are mostly categorical wherein businesses have some unique and some common features. In order to form a feature space for our analysis, we select the top N frequently occurring attributes in businesses and top N frequently occurring categories in business. We use this feature space for the ratings prediction. Figure 1 shows the architecture of the map-reduce jobs for feature selection. The first map-reduce job parses the JSON object for the business data to produce <bID, stars features>. The second map-reduce job reads this file to order the features by their frequency. Figure2 below show frequently occurring attributes and categories in Yelp dataset.

Given a set of features per business, we train machine learning models on the training data and use this model to predict the star ratings of any business from the testing data. We tried regression models to predict rating based on the count of features from feature space. However, this approach did not work properly. Therefore we moved to classification approach. We used multiple models from scikit-learn on the categorical feature space viz., Support Vector Machine (SVM) with linear kernel, SVM RBF kernel, Stochastic Gradient Descent (SGD), SGD with kernel. We formulated the classification problem as a multi-class classification problem with 11 output classes corresponding to the 11 values of ratings viz., [0, 0.5, 1, 1.5, 2, 2.5, 3, 3.5, 4, 4.5, 5]. The results were better as compared to linear regression but not really the best. The classifiers work well only for a few of the classes, for example class 8 class 10 from figure 3. This suggest that we need to extract better features from the datasets or tune the parameters of classifiers better.
Evaluation of classification models:
The dataset we use on categorical feature space (i.e., attributes) has 144072 samples (i.e, business_id). We divide the dataset into 80-20 train-test split. Ground truth is the available ratings in terms of stars (out of 5). For the purpose of classification we convert the class values from floating values to integer values by multiplying by 2. Therefore classes [0, 1, 2, 3, 4, 5, 6, 7, 8, 9, 10] represent the actual rating of [0, 0.5, 1, 1.5, 2, 2.5, 3, 3.5, 4, 4.5, 5]. Figure 3 shows the Precision, Recall, and f1 scores for the classification methods. This is clearly not the best outcome of training a classifier, but given the time constraints for this class project we had dto settle to these results without doing any further analysis.

Sentiment analysis:
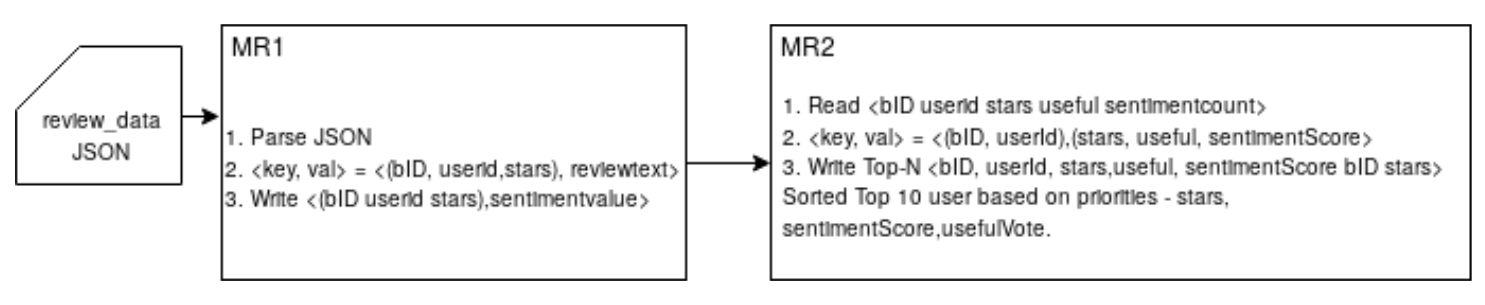
We use the set of reviews associated with every business_id retrieved from the 'user reviews dataset' using Map Reduce.The architecture of the map-reduce jobs is given in figure below. At the end of the first map-reduce job, we get the data in the format <reviewID, stars [review text]>;. We find the overall sentiment for a given business following the sentiment analysis method described in the article [1]. Finally, we integrated the individual user reviews with their sentiment value with the ‘business dataset’ using ‘business_id’ as the primary key. Then we find the mean value of the sentiment for each business based on the sentiments of all the review for that business. We use two text files pos-words.txt and neg-words.txt [1] to get a set of positive and negative words. Then we find the total number of positive and negative words that are mentioned in a review. Now, using following formula described in [1] we calculate the total sentiment value associated with the review.
\begin{equation} sentimentValue = (nPositive − nNegative)/(nPositive + nNegative) \label{eq:t1} \end{equation}
This method tell whether the reviews are of positive, negative, or neutral sentiment. This analysis helps the business owner determine the overall sentiment about their business and whether they need to improve their service or features knowing their average review sentiment value between -1 to +1.
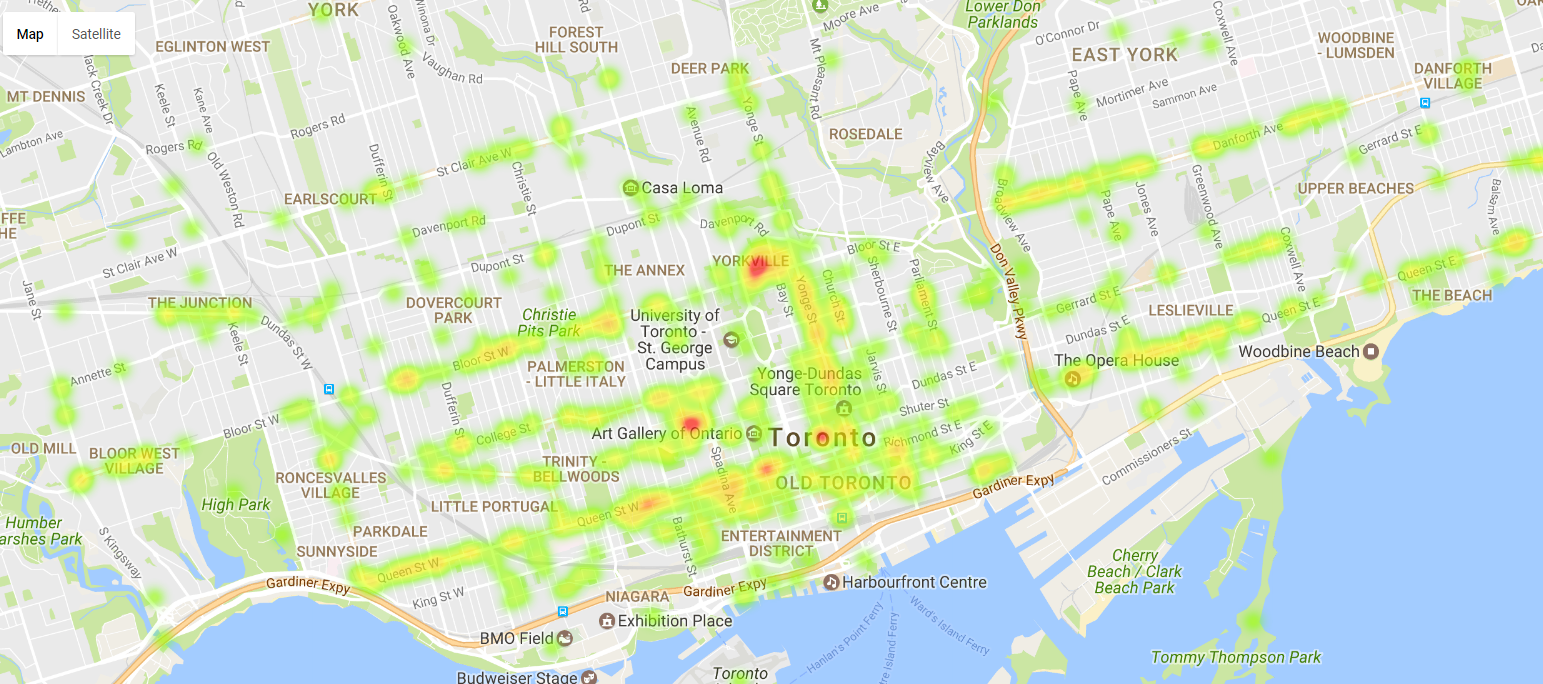
Geo-spatial Visualization of Ratings:
- Visualization reveals trends in star ratings within a city
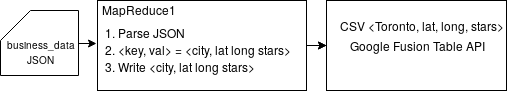
- Used MapReduce jobs with ‘city’ as key to Parse business_data
- For a specific city, collected all Business_id, Latitude, Longitude, and Stars
- Used Google Fusion Table API for plotting heatmap (representing highly rated businesses) overlaid on the geographic map of the city. For example, figure below shows highly rated businesses in Toronto city.
References: